

 about
projects
people
publications
resources
resources
visit us
visit us
search
search
about
projects
people
publications
resources
resources
visit us
visit us
search
search
Quick Links
Recent Citations
Structure of mitochondrial pyruvate carrier and its inhibition mechanism. He Z, Zhang J et al. Nature. 2025 May 1;641(8061):250–257.
Structures and mechanism of the human mitochondrial pyruvate carrier. Liang J, Shi J et al. Nature. 2025 May 1;641(8061):258-265.
Metabolic signaling of ceramides through the FPR2 receptor inhibits adipocyte thermogenesis. Lin H, Ma C et al. Science. 2025 May 1;388(6746):eado4188.
Chanoclavine synthase operates by an NADPH-independent superoxide mechanism. Chen CC, Yu ZP et al. Nature. 2025 Apr 17;640(8059):840-846.
A small-molecule SARS-CoV-2 inhibitor targeting the membrane protein. Van Damme E, Abeywickrema P et al. Nature. 2025 Apr 10;640(8058):506–513.
Previously featured citations...Chimera Search
Google™ SearchNews
March 6, 2025
Chimera production release 1.19 is now available, fixing the ability to fetch structures from the PDB (details...).
December 25, 2024

|
October 14, 2024
Planned downtime: The Chimera and ChimeraX websites, web services (Blast Protein, Modeller, ...) and cgl.ucsf.edu e-mail will be unavailable starting Monday, Oct 14 10 AM PDT, continuing throughout the week and potentially the weekend (Oct 14-20).
Previous news...Upcoming Events

UCSF Chimera is a program for the interactive visualization and analysis of molecular structures and related data, including density maps, trajectories, and sequence alignments. It is available free of charge for noncommercial use. Commercial users, please see Chimera commercial licensing.
We encourage Chimera users to try ChimeraX for much better performance with large structures, as well as other major advantages and completely new features in addition to nearly all the capabilities of Chimera (details...).
Chimera is no longer under active development. Chimera development was supported by a grant from the National Institutes of Health (P41-GM103311) that ended in 2018.
Feature Highlight


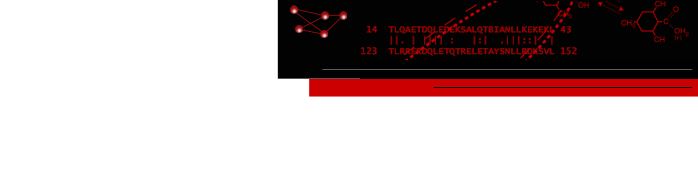
Protein backbone angles can be shown in a Ramachandran Plot along with probability contours (green lines) from a reference set of well-determined structures. Each amino acid residue is shown as a dot in a graph of φ vs. ψ, more commonly known as a Ramachandran plot or Ramachandran map. Residues are shown as blue dots, or when selected, as red dots. In the example, all helix residues have been selected. Conversely, clicking a dot in the plot will select the corresponding residue in the structure. When the plot has mouse focus, the cursor position (x = φ, y = ψ) is reported under the plot.
(More features...)
Gallery Sample
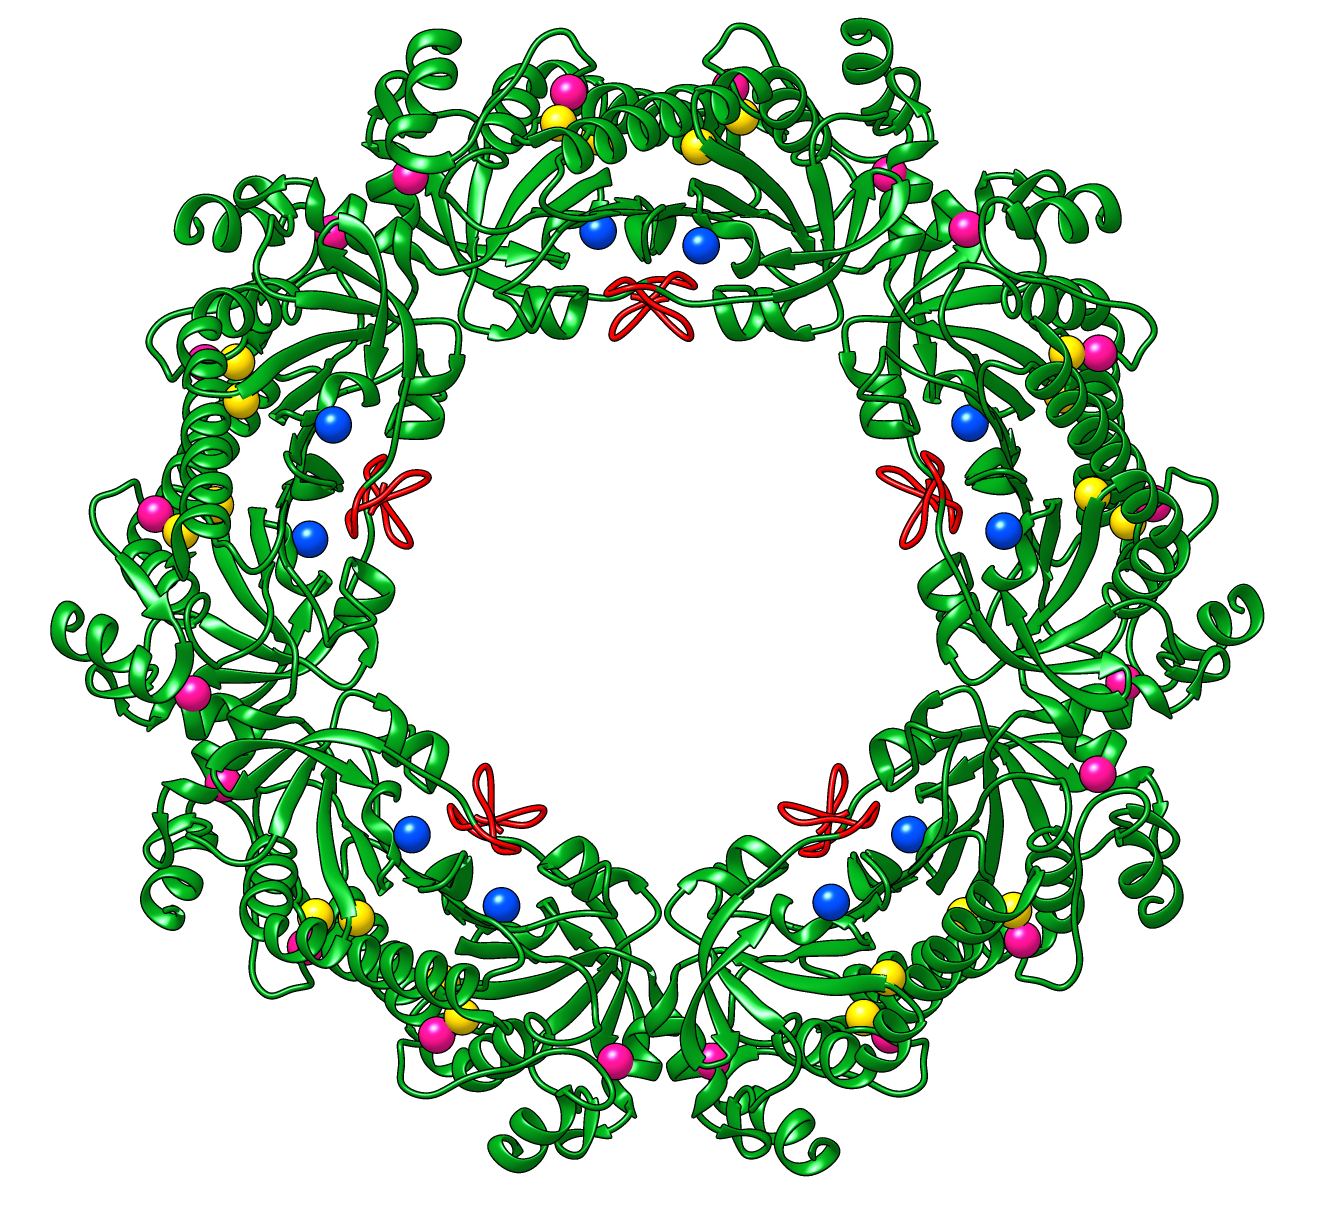
Peroxiredoxins are enzymes that help cells cope with stressors such as high levels of reactive oxygen species. The image shows a decameric peroxiredoxin from human red blood cells (Protein Data Bank entry 1qmv), styled as a holiday wreath.
See also the RBVI holiday card gallery.
About RBVI | Projects | People | Publications | Resources | Visit Us
Copyright 2018 Regents of the University of California. All rights reserved.