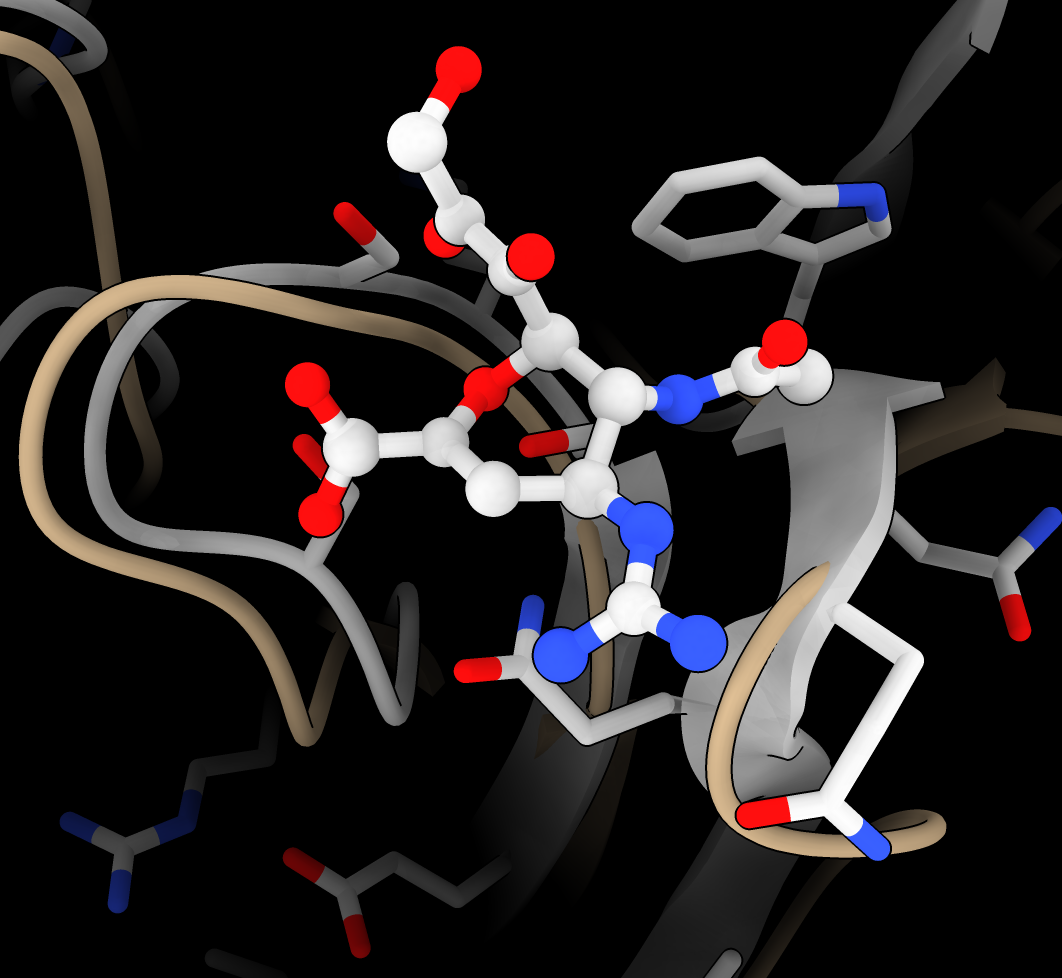
Exploring atomic models, NMR and cryoEM data, and Foldseek results with ChimeraX
Tom Goddard
January 9, 2025
UCSF Macromolecular Methods class, 2 hour tutorial
This is an introduction to visualizing atomic models, NMR restraints and chemical shifts, cryoEM maps,
and ensembles of homolog structures found by Foldseek using ChimeraX 1.9. If this tutorial is opened within ChimeraX (menu Help / Tutorials), then the command links can be clicked to run the commands.
Topics
Exploring atomic models: Heat shock protein HSP90
Look at N-terminal domain of HSP90 which helps refold proteins.
Functions as a dimer that holds unfolded protein with two hydrophobic arms and brings them together with energy from ATP.
- Open human hsp90a with PU-H71 anti-cancer drug bound.
open 2fwz
- Try Mac trackpad 2,3,4-finger drag for rotation, translation, zoom.
- Try different styles, all atom, sphere, stick, surface.
- Show Presets / Original Look.
- Color PU-H71 menu Select / Structure / ligand and Actions / Color / magenta, by heteroatom
select ligand
color sel orange
color sel byhet
- PU-H71 is an purine analog binding where hsp90 normally binds ATP and ADP.
- Compare ADP bound to human hsp90a
open 6gq6
- Align 6gq6 to 2fwz
matchmaker #2 to #1
- Close 6gq6
close #2
- Show hydrogen bonds from ligand to protein and water
hbonds ligand reveal true
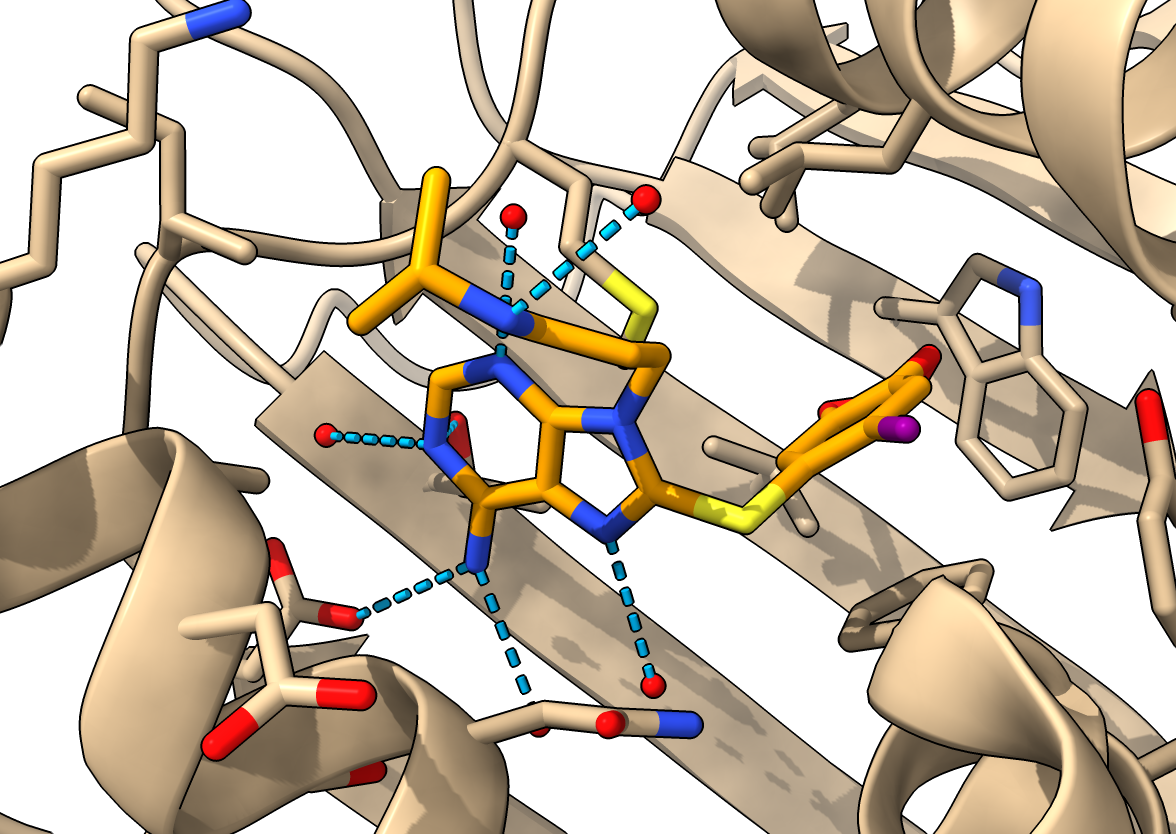
- Show zone 5A near ligand, hiding cartoon and more distant atoms for clearer view.
hide atoms,ribbon
show ligand :< 5
- Show surface near ligand with hydrophobic coloring
select ligand :< 5
Press Hydrophobic button on Molecule Display toolbar
- Show ligand as sphere to see how it fills pocket
Press Sphere button on Molecule Display toolbar
NMR ensemble and NOEs, how flexible is hsp90?
- Open hsp90a NMR ensemble, note variable helix positions
open 8jr6
- Hide 2fwz
Model Panel uncheck button in eye column for 2fwz
- Morph between ensemble conformations
morph #2
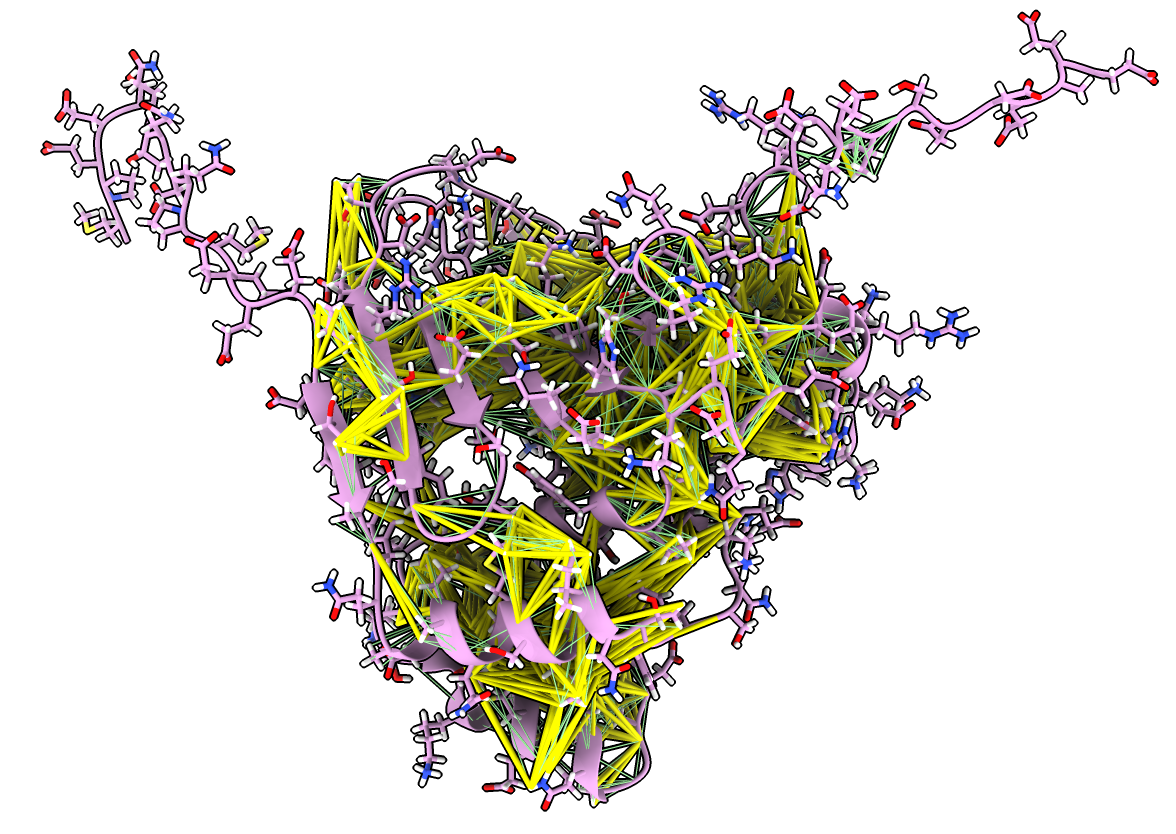
- Open NMR constraints, green satisfied, yellow too long
open 8jr6 from pdb_nmr models #3
- Moving helices have many constraints.
NMR chemical shift changes when PU-H71 bound
Look at effect of PU-H71 on protein backbone chemical shifts.
- Open yeast hsp90 used when measuring NMR chemical shift perturbations
open 1ah8
- Delete chain B of 1ah8 dimer and align to 2fwz
delete #4/B
mm #4 to #1
- Download attribute file Hsp90_NTD_PU-H71_csp.defattr with chemical shifts
- Open NMR chemical shift perturbations
open ~/Downloads/Hsp90_NTD_PU-H71_csp.defattr
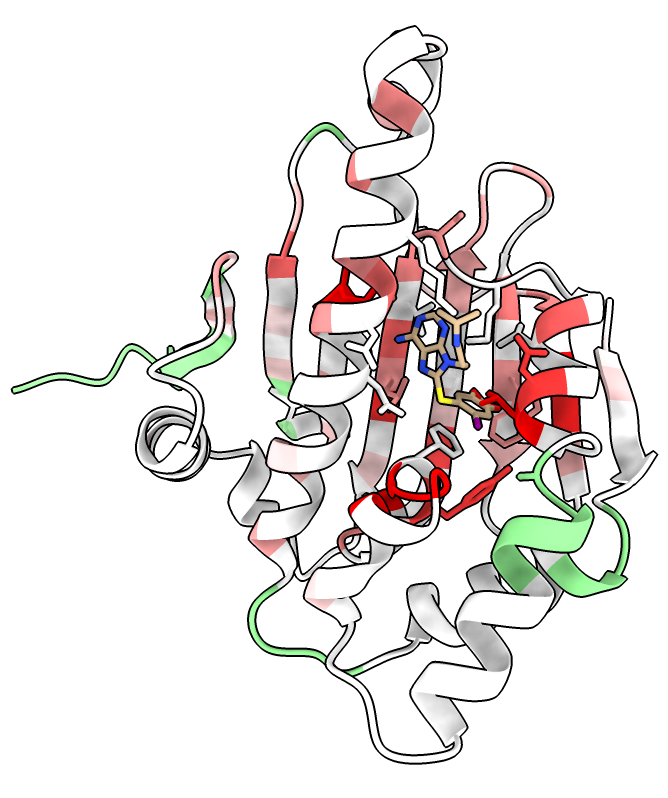
- Color 1ah8 residues by chemical shift perturbation (csp) with menu Tools / Depiction / Render by Attribute or command
color byattribute r:csp #4 palette 0,white:0.2,red
- Show PU-H71 ligand only 1ah8 residues within 5A.
hide #1 ribbon
hide #1 & ~ligand
show #4 & #1:H71 :< 5
hide :GOL | solvent
- Note PU-H71 effects are wide-spread, not just near the PU-H71
Electron microscopy maps: Human olfactory receptor
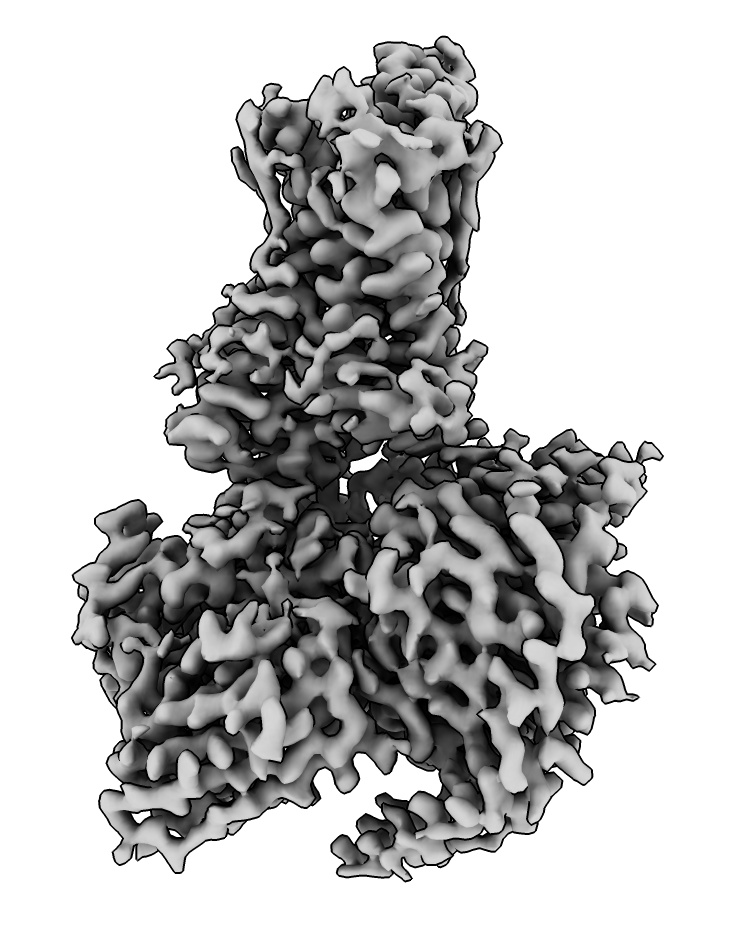
Look at a human olfactory receptor (GPCR) with odorant molecule propionate bound,
solved by cryoEM at 3.1 Angstroms.
- Close previous models, Model Panel close button.
close
- Open PDB 8f76.
open 8f76
- Select chains from log table to identify olfactory receptor and G-protein and nanobody.
- Use Log "more info" link to download map or command.
open 28896 from emdb
- Hide atomic model using Model Panel
hide #1 model
- Show step 1, full resolution.
volume #2 step 1
- Raise volume contour level to hide noise using histogram bar.
volume #2 level 0.7
- Alternatively use recommended level of 0.54 that it started with and Map toolbar Hide Dust button.
surface dust #2 size 8.1
Fit AlphaFold model in map
As a first step toward building a model into this cryoEM map we can try
to fit an AlphaFold model for the olfactory receptor part.
- Fetch a precomputed model from the AlphaFold database.
Use menu Tools / Structure Prediction / Alphafold, select Sequence / Uniprot Identifier / O51E2_HUMAN and press Fetch.
alphafold fetch O51E2_HUMAN
- If the sequence was mutated we could paste in the sequence and predict the structures, takes 13 minutes.
- Blue residues indicates high confidence score from AlphaFold.
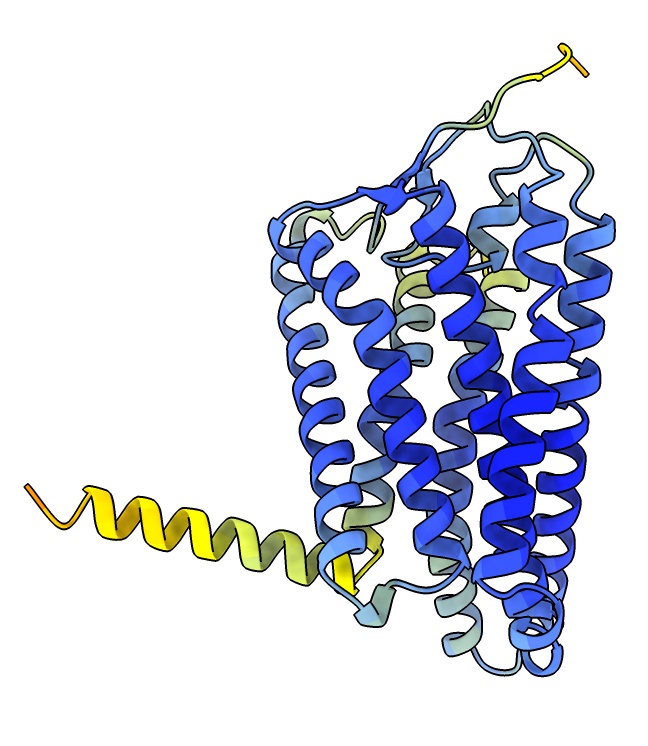
To fit the AlphaFold model into the map we will position it by hand then optimize the position.
It is easier to position by hand if the map is smoothed so helices are clearly visible.
- Smooth map. Use menu Tools / Volume Data / Map Filter, Gaussian, width 2.
volume gaussian #2 sDev 2
- Use the Move Selected mouse mode under Right Mouse and select a residue of the AlphaFold model with ctrl-click. Translate and rotate with shift key to put in model in map map. Hint yellow helix goes near G-protein end.
view matrix models #3,0.40692,0.60876,0.68104,119.26,-0.29794,0.79324,-0.53104,111.11,-0.86351,0.013184,0.50416,91.549
- Use Map toolbar Fit button to optimize hand placement in map.
fit #3 in #4
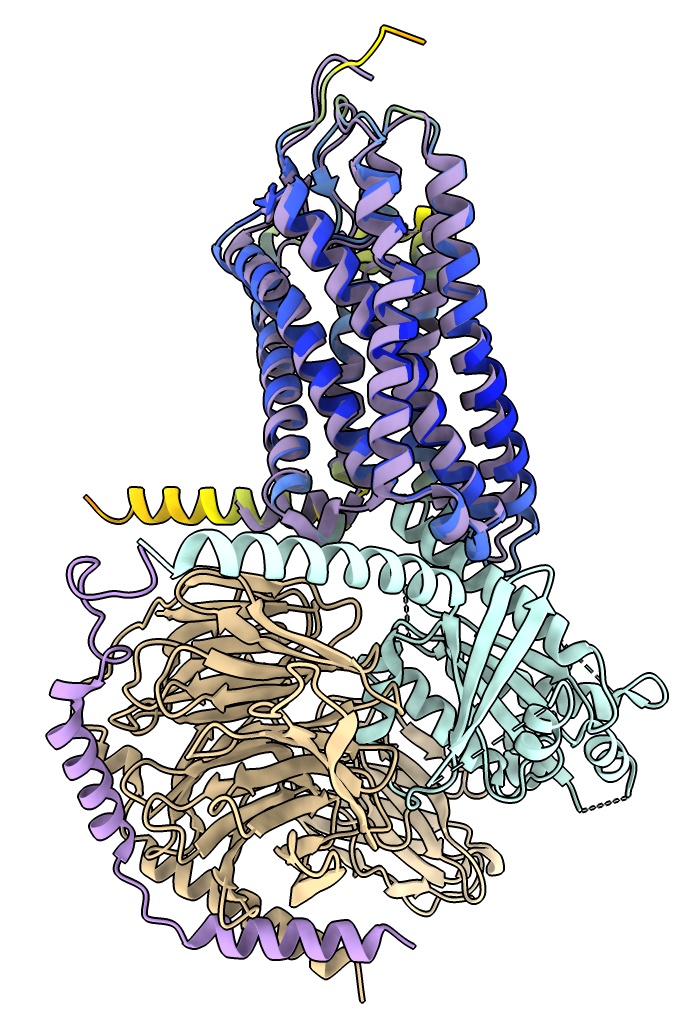
- See how this initial model compares to final structure, hide map, show 8f76 as cartoon.
volume #4 hide
show #1 model,cartoon ; hide #1 atoms
- Ends of two long transmembrane helices near G-alpha subunit are displace several Angstroms,
possibly because of the interaction with the nearby G-alpha helix.
- Next step could be to use ISOLDE plugin to ChimeraX to refine the position
of all residues in the map with interactive molecular dynamics.
Looking at homolog structures found by Foldseek: Nipah virus G protein
Look at hundreds of structures similar to one structure of interest to derive information.
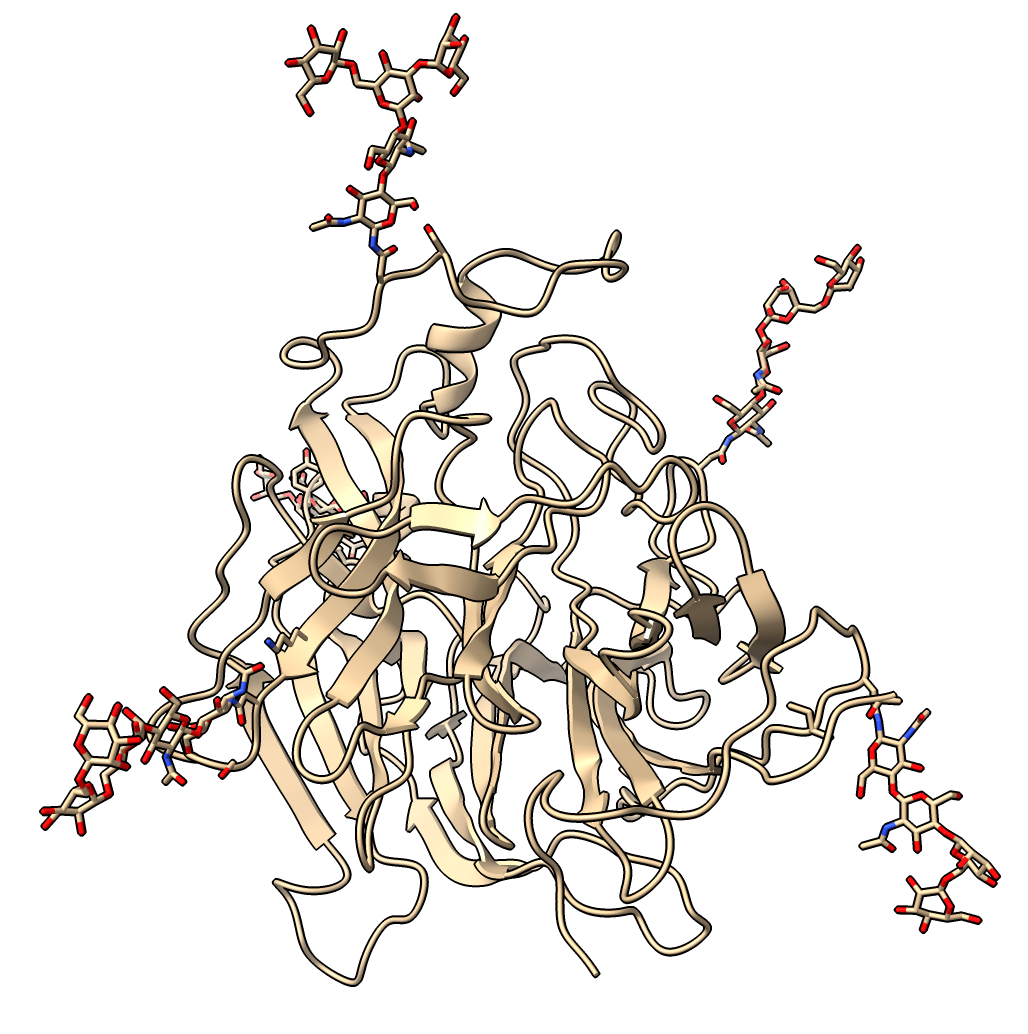
Example: Nipah virus glycoprotein G binds to target cell surfaces, 40% fatality rate in humans,
several outbreaks in Africa and Southeast Asia, PDB 8XPS.
- Close previous models
close
- Open Nipah G protein
open 8xps
- Note Log panel says chain B is an antibody. Will not look at it so delete it.
delete /B
- Run Foldseek search of structures with similar shape using Seoul National University server from Martin Steinegger lab to find 194 similar structures.
Use menu Tools / Structure Analysis / Similar Structures, press Search button.
- Note about 2/3 have sequence identity less than 10%, undetectable by sequence searches.
Influenza virus neuramidase has about 8-10% sequence similarity.
- Press Traces button to show backbones of hits.
- Press Clusters button to cluster structures by C-alpha atom positions of 5 most conserved residue positions.
- Right click on cluster plot and click menu entry Color traces to match plot
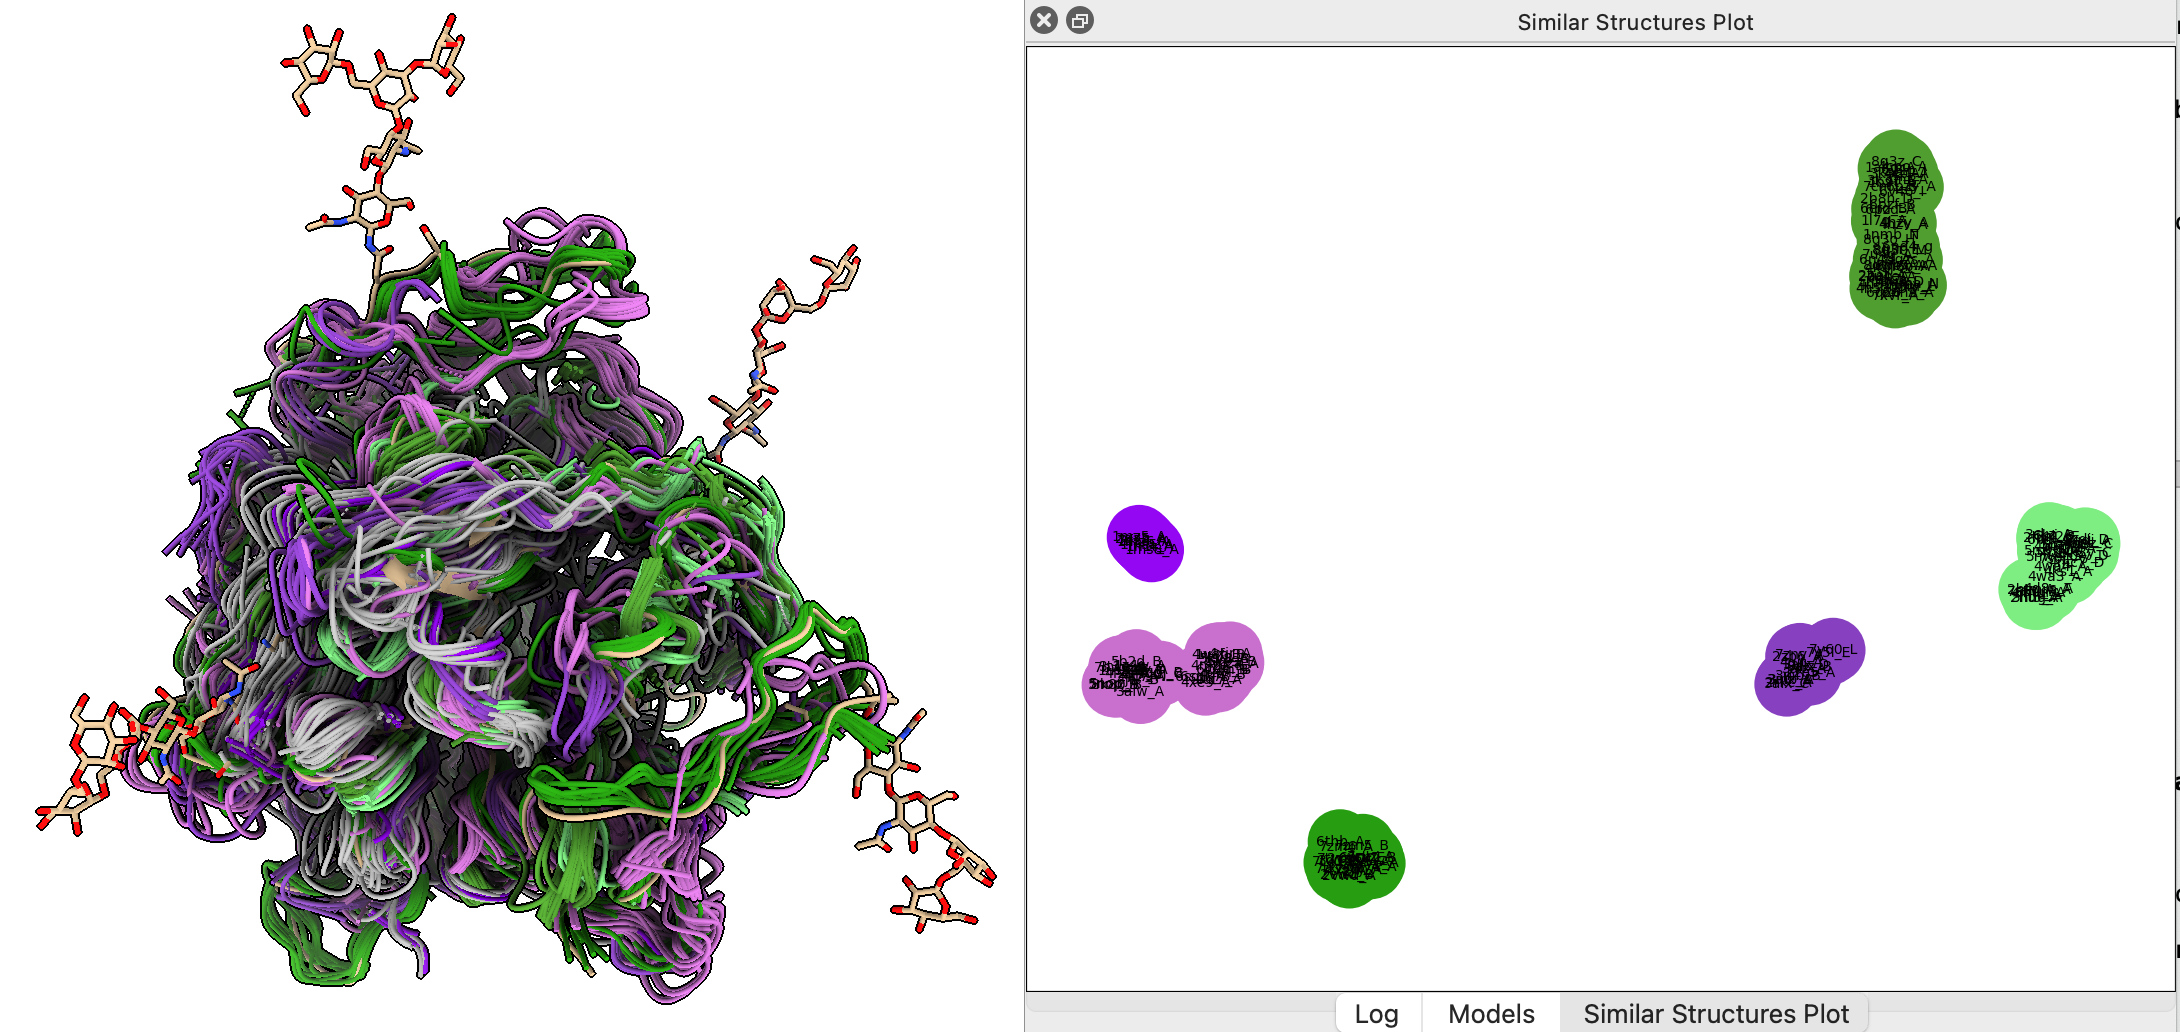
Finding ligands bound to similar structures
- Open an influenza virus search result.
Click on 1inh_A table row and press Open.
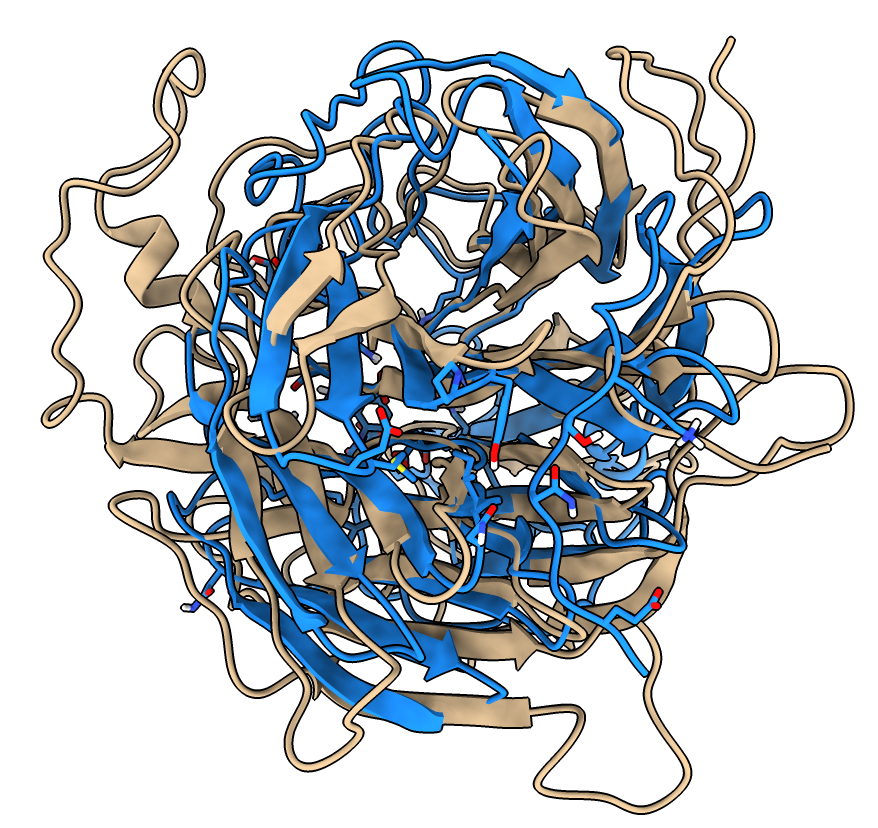
- Similar fold but differs in many surface loops.
- Click Species column header to order by species, and select all Influenza virus A rows.
- Under Options click Traces, clusters and ligands for selected rows only.
- Press Ligands button to copy ligands from flu structures to Nipah G protein.
- Says it will fetch 20 structures from PDB. Takes about 20 seconds if structures fetched or 5 seconds if cached.
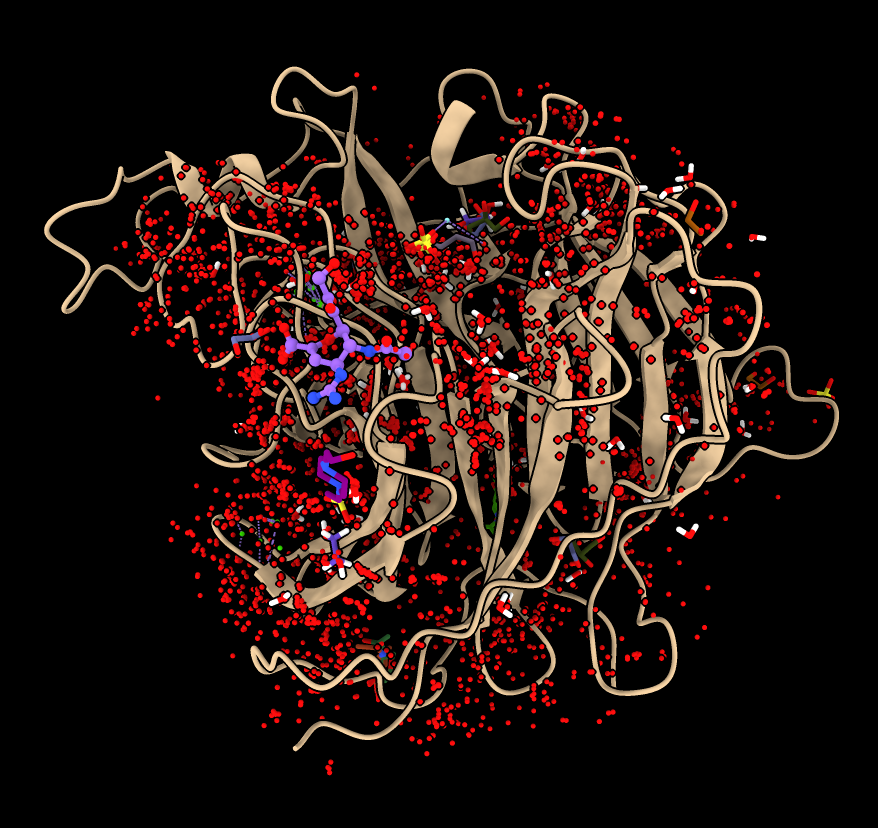
- Hide waters, calcium, sulfate and various sugars (you can look up info on 3 letter codes).
hide #3:HOH,CA,SO4,MAN,NAG,BMA,FUL,FUC
- Hover over remaining ligand (ZMR from 2CML chain A), FDA approved drug zanamivir for flu treatment.
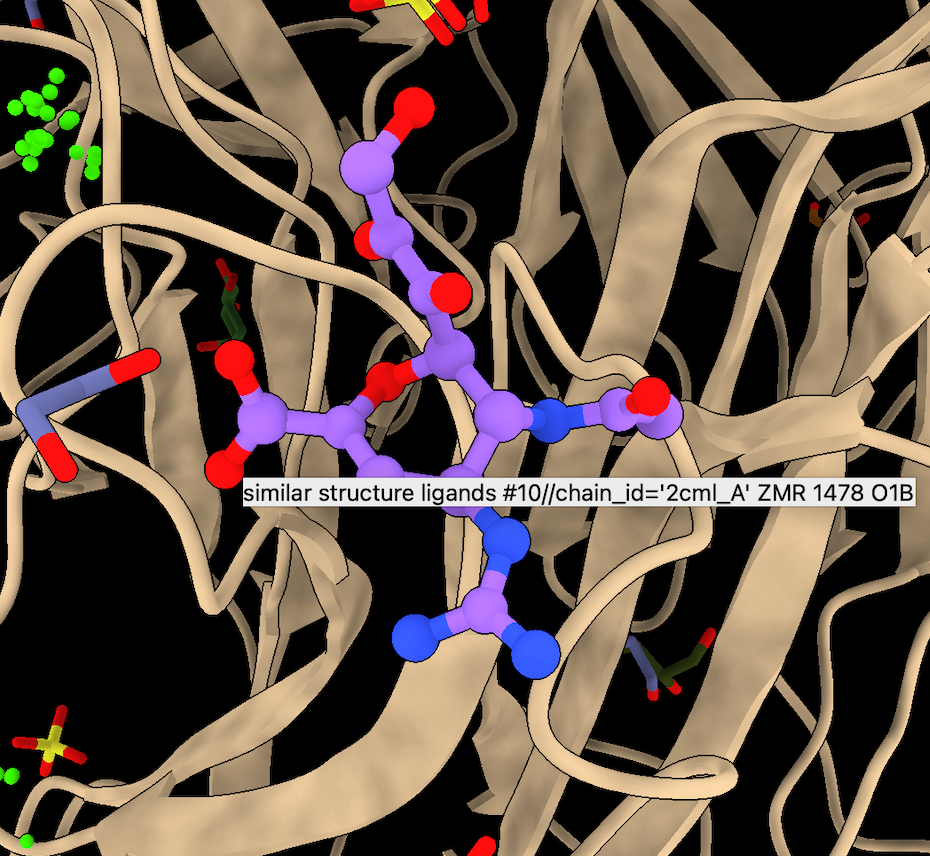
- Select 2cml_A line from foldseek table and Open to see backbone approximately matches.
